AURORA & SPACE WEATHER — A FIELD GUIDE
This is the manual for everything the observatory shows you: what the aurora is, what the numbers in the data panel mean, how forecasting works (and where it can't), and how to put yourself under the sky when it happens. Factual claims are pinned to the primary literature in the numbered sources below, several of which don't just inform this observatory — they run as code inside its renderer.
What the aurora is
The sun continuously boils off a wind of charged particles that washes over Earth at 300–800 km/s. Earth's magnetic field deflects almost all of it — but the encounter stores energy in the stretched magnetic tail behind the planet. When that stored energy releases, electrons are accelerated down magnetic field lines into the upper atmosphere, where they slam into oxygen and nitrogen at altitudes of roughly 90–300 km. Each collision makes an atom glow at a color set by atomic physics, not by chance:
- Green (557.7 nm, oxygen) — the workhorse, emitted around 100–150 km. Most of the light in most displays.
- Red (630 nm, oxygen) — a "forbidden" slow transition that only survives in the thin air above ~200 km. Tall red tops on strong storms, and the color low-latitude observers usually see on the horizon. The red-to-green ratio is diagnostic of how hard the electrons are driven1,2.
- Pink, purple and blue (nitrogen) — hard-driven displays push electrons deeper, below ~100 km, lighting nitrogen along the lower fringes of fast-moving curtains.
The vertical rays and curtains are not wind-blown shapes — they trace magnetic field lines, which is why they all appear to converge overhead in a corona during a big display. That geometry is exactly what the observatory's 3D renderer draws.
Aurora comes in a zoo of distinct shapes — arcs, bands, rays, pulsating patches, SAR arcs, STEVE and more, several of them citizen-science discoveries. They get their own chapter: the shapes of the aurora, each form tagged with what this renderer does with it.
Reading the colors
The colors form a vertical ladder, and the ladder never reorders. Each emission needs the right atom and enough undisturbed time to radiate. Oxygen's red line holds its energy for about 110 seconds, so below ~200 km collisions drain it before it can shine — red exists only at the top of a curtain. Oxygen's green line radiates in under a second and survives down to roughly 95 km. Below that the atmosphere is well-mixed and molecular — atomic oxygen runs out — so the hardest-driven electrons light nitrogen instead: a pink-magenta fringe along the bottom edge of bright, fast-moving curtains at ~85–100 km1. Near 80 km the light ends; the rare electrons that punch deeper announce themselves as radio absorption, not glow. Top to bottom the sequence is fixed: red, green, pink — never green again beneath the pink.
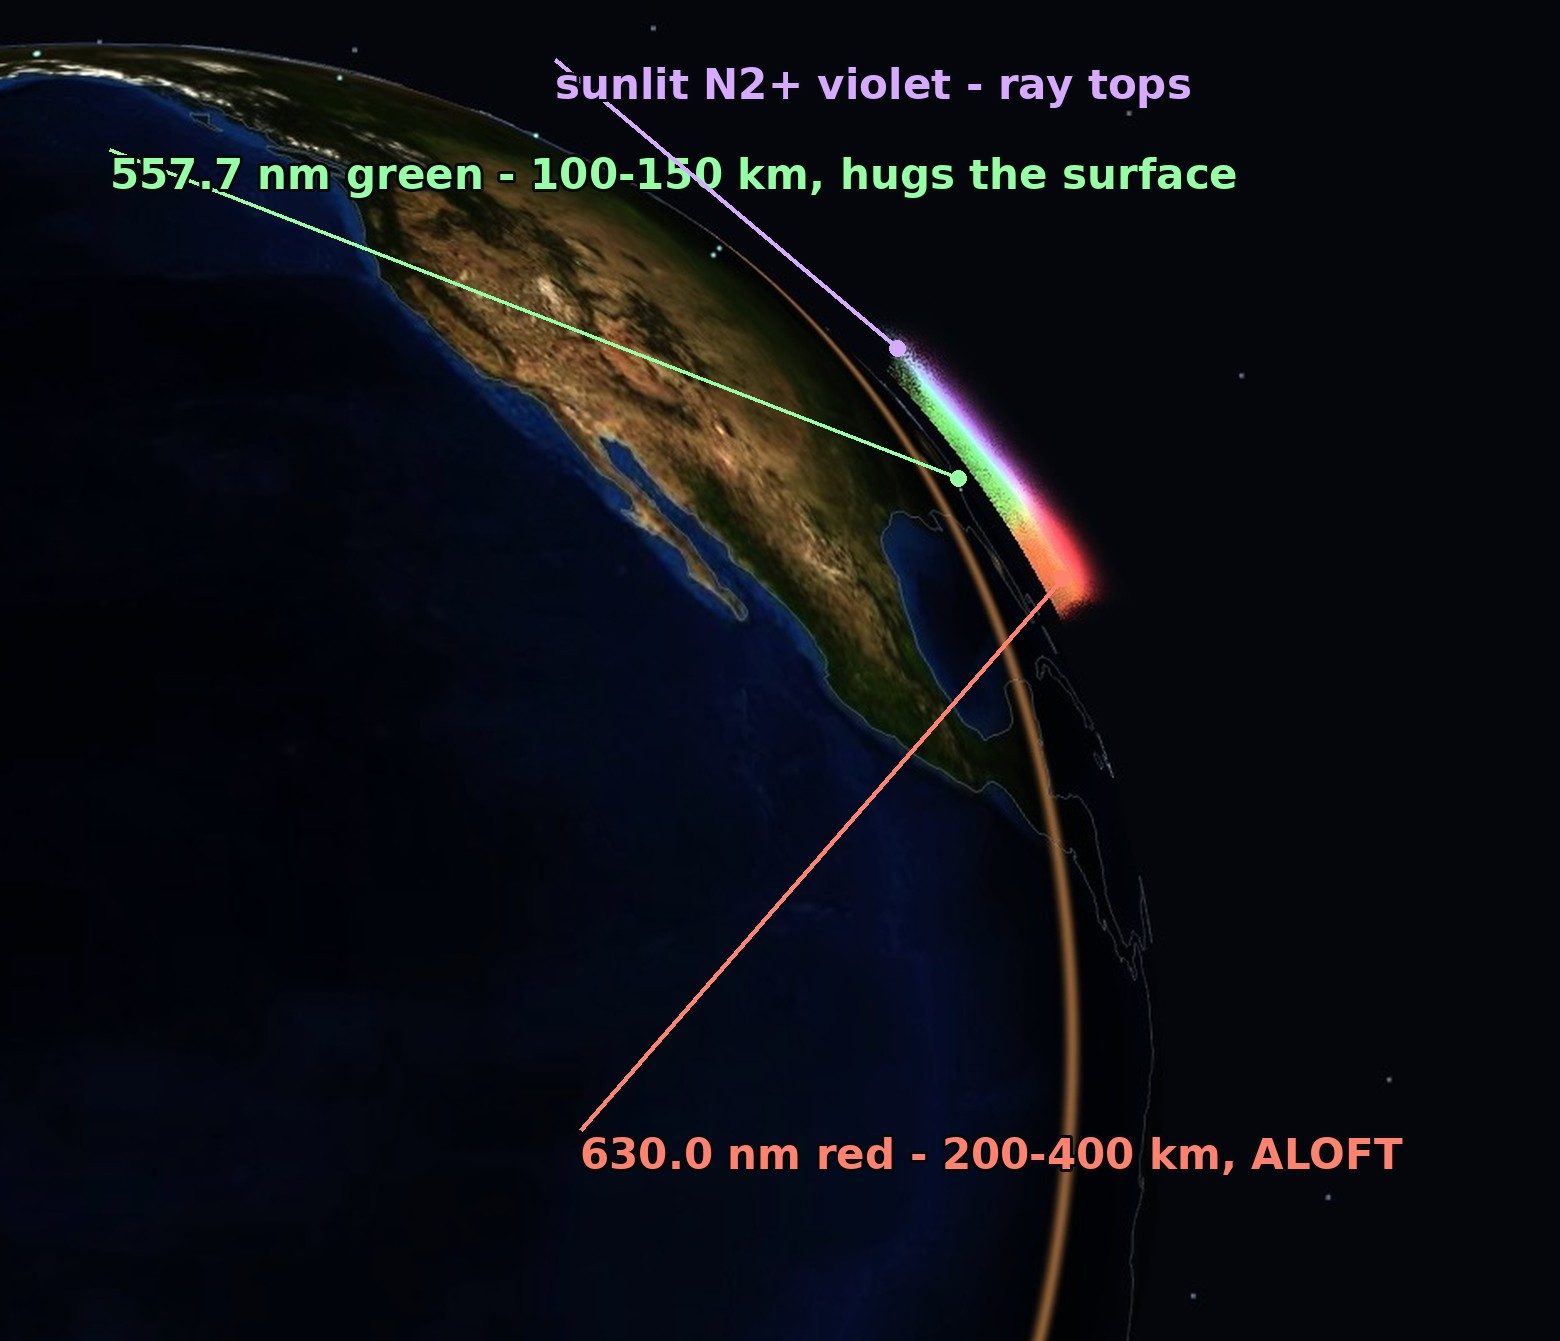
Your sky can still put red beneath green, because distance reshuffles the ladder. The higher an emission sits, the farther away it stays visible: green at ~105 km sets below your horizon about 1,150 km out, while 250–400 km red carries to ~2,200 km. Aurora in that outer ring reaches you as pure red, compressed into the lowest degrees of sky. Seen from outside the oval, that is the familiar red glow on the poleward horizon; from inside it during a great storm, near curtains hang green overhead while the far, equatorward side of the oval spreads red beneath them. The order is set by distance, not altitude — far aurora is red aurora. Scaled up, that is how the 1859 storm reddened skies over the Caribbean12.
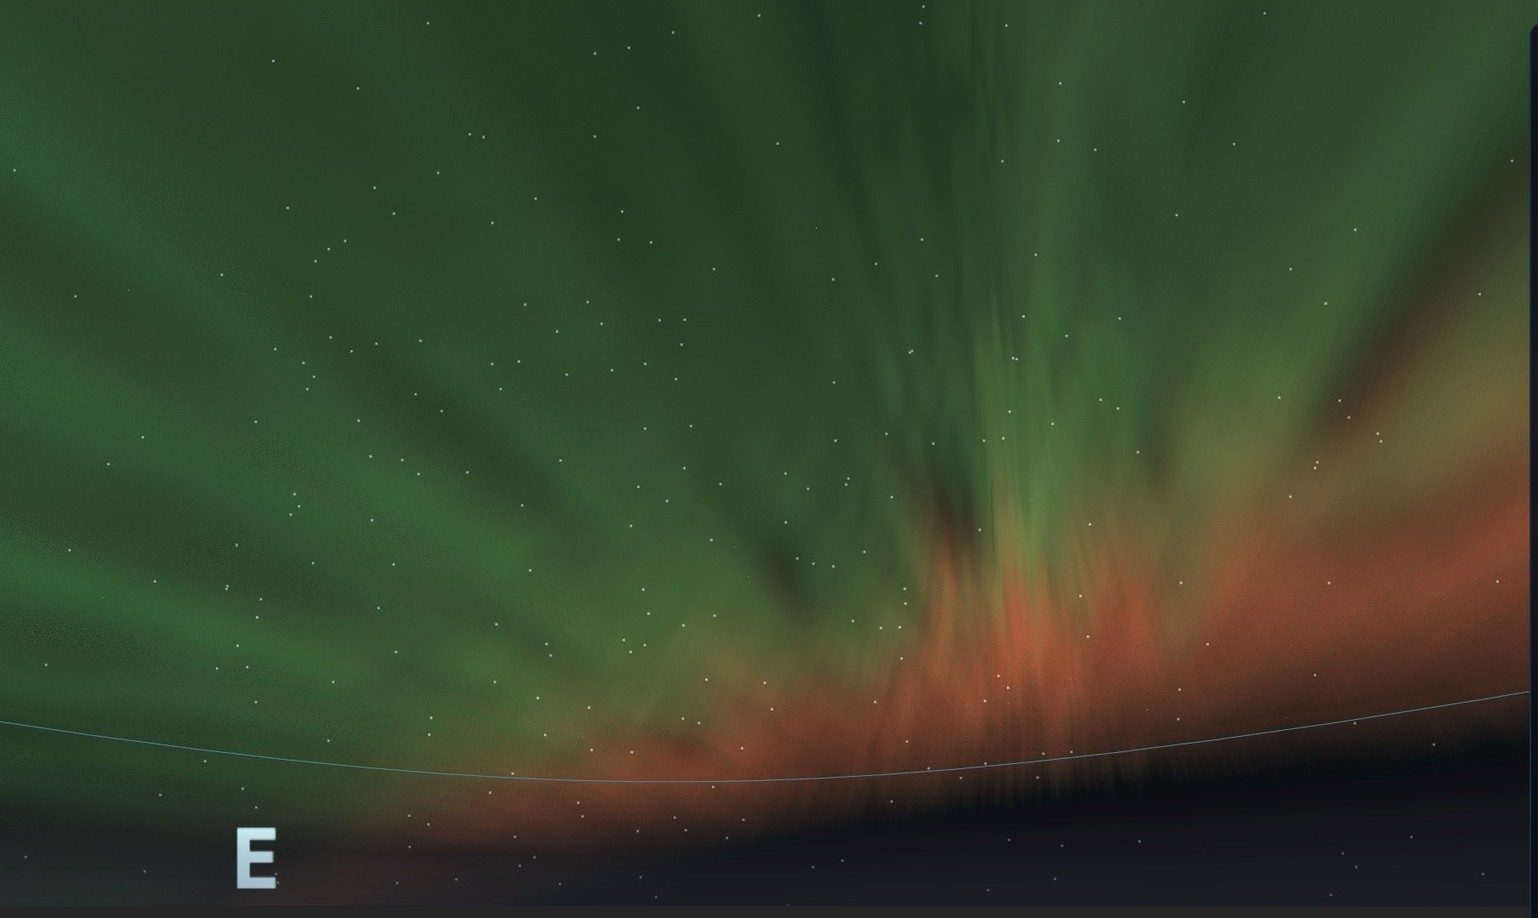
Color is also a diagnostic. The red-to-green ratio tracks how hard the electrons are driven1,2: gentle precipitation runs red-heavy — why the oval's equatorward edge and quiet high-latitude arcs lean red — while hard precipitation runs green, hemmed pink at the very bottom. Blue-violet ray tops mean the rays have climbed into sunlight above Earth's shadow. The renderer hard-codes none of this: the ladder, the ratios and the horizon ordering all emerge from running the emission physics along your line of sight.
See it yourself: load a great-storm replay in the observatory, plant yourself in a mid-latitude town in horizon view, and face equatorward — green overhead, red hugging the horizon.
Flares, CMEs and coronal holes
Solar flares
A flare is a flash of X-rays and extreme ultraviolet from magnetic reconnection above a sunspot group. Its light reaches Earth in 8 minutes. Classes run A, B, C, M, X — each step ten times stronger, and the number scales within the class (an X2 is twice an X1, an X10 ten times). Flares cause immediate dayside radio blackouts, but a flare by itself does not cause aurora.
Coronal mass ejections (CMEs)
The main event. A CME is on the order of a billion tons of magnetized plasma launched into space, often (not always) alongside a big flare. If it's aimed at Earth it typically arrives in 1.5–3 days. The fastest transit on record is 14.6 hours, set by the ultra-fast ejecta of August 19723; the 1859 Carrington CME took about 17.64. Whether it produces a great storm depends on its speed, density, and above all the orientation of its magnetic field when it hits — which is the part nobody can measure until it's nearly here.
Coronal holes
Dark (in EUV) regions where the sun's field opens directly into space, letting a fast stream escape at 500–800 km/s — pinned down as the source of high-speed streams during the Skylab era5. They rotate with the sun, so their storms recur on a ~27-day cadence. They rarely make headlines, but they are the reliable bread and butter of high-latitude aurora photographers.
You can watch all three on the observatory's sun page — live imagery, active regions, flares and CME analyses.
Reading the numbers
The observatory's data panel shows the same quantities forecasters watch. Here's how to read them:
Kp — the headline index
Kp (0–9) is a 3-hour, planet-wide average of geomagnetic disturbance, computed by GFZ Potsdam from a 13-observatory network with a homogeneous record back to 19326. NOAA's G-scale maps onto it7:
| G-scale | Kp | Storm class | Rough visibility (northern hemisphere) |
|---|---|---|---|
| — | 0–4 | Quiet–active | Arctic latitudes; occasionally the northern-tier US/Scotland horizon at Kp4 |
| G1 | 5 | Minor | Low on the horizon from the northern US states, Denmark, Scotland |
| G2 | 6 | Moderate | Overhead in southern Canada; horizon glow into the mid-northern US |
| G3 | 7 | Strong | Visible from the mid-latitude US (Oregon, Illinois), central Europe |
| G4 | 8 | Severe | Deep into the US and mid-Europe; color for many observers |
| G5 | 9 | Extreme | Continent-scale. May 2024 drew naked-eye reports from 24.3° magnetic latitude8 |
The catch: because Kp averages three hours of the whole planet, the sky can erupt and collapse entirely inside one Kp bin. That's why this observatory renders substorms minute-by-minute instead of painting a static Kp oval.
Bz — the gatekeeper
The north–south component of the interplanetary magnetic field. When Bz points south (negative), it can merge with Earth's northward-pointing field — the magnetic reconnection Dungey identified in 19619 — and the door opens; when it points north, even a fast, dense wind mostly bounces off. Sustained −10 nT is promising; −20 nT is severe-storm territory; the May 2024 superstorm spent hours far below that. If you learn to read one number beyond Kp, make it this one — then drag it south yourself in the Storm Lab and watch the door open.
Solar wind speed and density
350–400 km/s is quiet. 550+ suggests a coronal-hole stream. 700+ is CME territory, and the May 2024 event pushed toward 1000 km/s. Density above ~20 protons/cm³ adds punch — it raises the pressure the wind exerts when Bz lets it couple.
Dst / SYM-H — the storm's official size
These measure the ring current that a storm injects around Earth, in negative nanotesla. Around −50 nT is a moderate storm, −100 intense, and below −250 a superstorm. May 2024 bottomed out at −412 nT — the strongest since November 200310. The March 1989 storm that blacked out Québec reached −589 nT11; for the 1859 Carrington event the original estimate was a staggering −1760 nT12, with modern reassessments near −90013.
AE — the substorm meter
The auroral electrojet index tracks currents flowing in the auroral zone itself — the minute-by-minute violence. When AE spikes, somebody's sky is exploding.
Substorms — why the sky "explodes"
The aurora is not on a dimmer switch; it runs a loading–unloading cycle called a substorm, whose anatomy Akasofu mapped in 196414. During growth (~30–60 minutes) quiet arcs sit low and the magnetotail stretches. At expansion onset the tail snaps: within minutes arcs brighten, break into rays, and can race to the zenith — the unforgettable 10–30 minutes people chase. Recovery follows for an hour or two with pulsating patches, and during storms the whole cycle repeats every 2–4 hours. That's why "nothing at 10:10 pm" can become "overhead at 10:40," and why walking back inside after twenty minutes is the classic mistake.
It's also why the observatory has an instant-versus-averaged display toggle — the same reason weather models offer instantaneous radar alongside 6-hour accumulations. A time-averaged aurora is a smooth ribbon; the instantaneous sky is spikier, structured, and briefly much brighter.
Seeing it for yourself
Darkness, timing, substorm patience, moonlight, and the difference between what your camera records and what your eyes will see — the practical side has its own chapter: how to see the aurora.
What forecasts can and can't do
Days out: after an Earth-directed CME, models like WSA–Enlil predict arrival windows — with a verified mean absolute error of 10.4 ± 0.9 hours across seven years of real-time runs15. Multi-day Kp forecasts are educated estimates of magnitude, not schedules.
Under an hour out: the only hard truth comes from spacecraft at the L1 point, 1.5 million km upstream, which measure the actual wind — including Bz — 15 to 45 minutes before it reaches Earth. A CME's internal field orientation is essentially unknowable until then, which is why perfectly good forecasts bust in both directions.
Anyone promising you an aurora three nights out, to the hour, is selling something. The observatory's forecast scene is labeled as what it is: a simulation of what the predicted numbers would look like, driven by the same physics as everything else here.
The great storms
Carrington 1859, the 1921 railroad storm, Québec 1989, Halloween 2003, and May 2024 — every one explorable in 3D in the observatory, and every one documented with primary sources in its own chapter: the great storms.
Frequently asked questions
- Do solar flares cause the aurora?
- Not directly. A flare is light — it arrives in 8 minutes and affects radio, not the night sky. Aurora comes from the CME (or fast wind stream) that may accompany a flare, arriving one to three days later. Big flares are a hint that a CME may have launched, nothing more.
- Why did the forecast bust?
- Usually Bz. A CME can arrive on schedule but with its magnetic field pointed north, and the sky stays quiet; or a modest stream turns strongly south and over-delivers. Field orientation can't be measured until the plasma passes the L1 monitors — 15 to 45 minutes before Earth. Arrival-time predictions also carry ~10-hour average errors15. That uncertainty is physics, not incompetence.
- Is solar maximum over — did I miss the big storms?
- Solar Cycle 25 peaked around 2024–2516, but the declining phase historically produces some of the largest storms — the Halloween 2003 superstorms came three years after that cycle's maximum, and coronal-hole activity actually improves as a cycle declines. The next few years remain very much worth watching.
- Why is the aurora red near the horizon?
- Distance. The higher an emission sits, the farther away it stays visible: green at ~105 km sets below your horizon about 1,150 km out, while 250–400 km red carries to ~2,200 km — so the farthest aurora in view arrives as pure red, compressed into the lowest few degrees of sky. In a great storm the same geometry works equatorward too: green curtains overhead, the distant side of the oval red beneath them. See Reading the colors.
- Is this AI?
- No — and it isn't video either. Every frame is computed by a physics engine: particle precipitation and emission physics running on measured solar-wind and magnetometer data, with the storm reconstructions checked against eyewitness photographs of the events themselves. Nothing on screen is generated by AI. Where a scene is synthetic — the forecast night, the storm lab — its label says model-generated, and the model in question is this physics model, not a generative one: load the same scene twice and it draws the same sky. It's the relationship a weather map has to the atmosphere — a physical model run on real observations. The data & methods page lists what is measured, what is modeled, and what is procedural.
Sources
Numbered references for the claims above, DOI-verified. Entries marked in the renderer are also implemented — their formulas or thresholds run as code in this observatory's engine (the data & methods page lists the full implementation set, including Fang, Newell, Robinson and Gjerloev).
- Rees, M. H. & Luckey, D. (1974). Auroral electron energy derived from ratio of spectroscopic emissions. J. Geophys. Res. 79, 5181–5186. doi:10.1029/JA079i034p05181in the renderer
- Steele, D. P. & McEwen, D. J. (1990). Electron auroral excitation efficiencies and intensity ratios. J. Geophys. Res. 95, 10321–10336. doi:10.1029/JA095iA07p10321in the renderer
- Knipp, D. J. et al. (2018). On the little-known consequences of the 4 August 1972 ultra-fast coronal mass ejecta. Space Weather 16, 1635–1643. doi:10.1029/2018SW002024
- Cliver, E. W. & Svalgaard, L. (2004). The 1859 solar–terrestrial disturbance and the current limits of extreme space weather activity. Solar Physics 224, 407–422. doi:10.1007/s11207-005-4980-z
- Krieger, A. S., Timothy, A. F. & Roelof, E. C. (1973). A coronal hole and its identification as the source of a high velocity solar wind stream. Solar Physics 29, 505–525. doi:10.1007/BF00150828
- Matzka, J. et al. (2021). The geomagnetic Kp index and derived indices of geomagnetic activity. Space Weather 19, e2020SW002641. doi:10.1029/2020SW002641
- NOAA Space Weather Prediction Center. NOAA Space Weather Scales. swpc.noaa.gov/noaa-scales-explanation
- Grandin, M. et al. (2024). The Gannon Storm: citizen science observations during the geomagnetic superstorm of 10 May 2024. Geoscience Communication 7, 297–316. doi:10.5194/gc-7-297-2024
- Dungey, J. W. (1961). Interplanetary magnetic field and the auroral zones. Phys. Rev. Lett. 6, 47–48. doi:10.1103/PhysRevLett.6.47
- Hayakawa, H. et al. (2025). The solar and geomagnetic storms in 2024 May: a flash data report. Astrophys. J. 979, 49. doi:10.3847/1538-4357/ad9335
- Boteler, D. H. (2019). A 21st century view of the March 1989 magnetic storm. Space Weather 17, 1427–1441. doi:10.1029/2019SW002278
- Tsurutani, B. T., Gonzalez, W. D., Lakhina, G. S. & Alex, S. (2003). The extreme magnetic storm of 1–2 September 1859. J. Geophys. Res. 108, 1268. doi:10.1029/2002JA009504
- Cliver, E. W. & Dietrich, W. F. (2013). The 1859 space weather event revisited: limits of extreme activity. J. Space Weather Space Clim. 3, A31. doi:10.1051/swsc/2013053
- Akasofu, S.-I. (1964). The development of the auroral substorm. Planet. Space Sci. 12, 273–282. doi:10.1016/0032-0633(64)90151-5
- Wold, A. M. et al. (2018). Verification of real-time WSA–ENLIL+Cone simulations of CME arrival-time at the CCMC from 2010 to 2016. J. Space Weather Space Clim. 8, A17. doi:10.1051/swsc/2018005
- NOAA Space Weather Prediction Center. Solar cycle progression. swpc.noaa.gov/products/solar-cycle-progression
Aurora, by location: live forecast guides for Minnesota · Michigan · Washington · Maine · Alberta · Ontario · Scotland · Norway · Tasmania · New Zealand — and 30 more on the full location index.
By The Space Weather Observatory · checked against the data & methods record · Updated August 21, 2026
the sky · the sun · data & methods · about · privacy · pro · ☁️ seasonmap · ☕ support