WHEN THE SKY REACHES THE GROUND
The aurora is the visible edge of an electrical event. The same storm that paints the sky drives millions of amps through the upper atmosphere — and some of that circuit reaches down into power lines, pipelines, satellites and radio paths. This chapter is the record of what geomagnetic storms have actually done to the systems we live on, pinned to the primary literature. The storms themselves live in the great storms; the physics in the field guide.
The circuit above your head
During a storm, the auroral electrojets — currents flowing roughly 100 km up, along the same oval this observatory renders — strengthen and move violently. A magnetic field that changes quickly over a continent induces an electric field in the ground beneath it, and that field pushes a slow, quasi-DC current through any long grounded conductor it can find: high-voltage transmission lines, pipelines, railway signaling1.
Power transformers are the soft target. They are built for pure alternating current; a DC bias pushes their magnetic cores into saturation for half of every cycle, which distorts the waveform, floods the network with harmonics, drains reactive power, and heats the transformer itself. Protective relays see the distortion and start tripping equipment offline — by design, and faster than any operator can react1,2.
Power grids: 92 seconds in Québec
On March 13, 1989, the largest storm of the instrumented era to that point (−589 nT) hit the Hydro-Québec grid. From the first relay trip to province-wide collapse took 92 seconds. Six million people lost power for about nine hours on a −15 °C night — the benchmark demonstration that a geomagnetic storm can take down a modern grid, not in theory but on the clock1.
It wasn't a one-off. The Halloween 2003 storms tripped the grid in southern Sweden, blacking out about 50,000 customers around Malmö2. The May 1921 storm — re-estimated at −907 ± 132 nT, roughly half again Québec's driver — burned out telegraph and railroad-signal equipment in New York when the most advanced electrical network of its day was a telegraph office3,4. And in 1859, the Carrington event set telegraph systems arcing on two continents5.
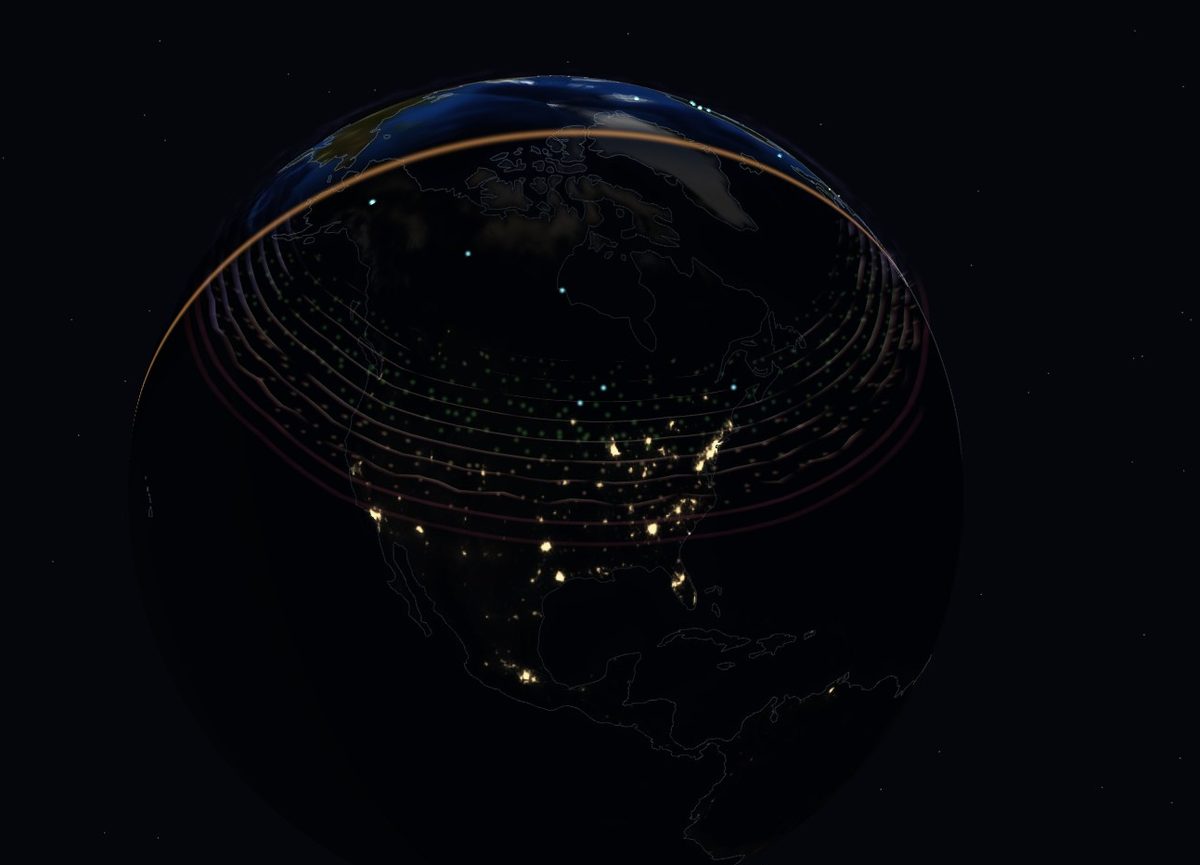
What would a Carrington-class storm do to today's grid? Honestly: nobody has measured one against a modern network, and this observatory doesn't pretend otherwise. The serious studies flag long-lead-time transformer damage as the tail risk and put the possible daily economic cost of an extreme-storm blackout in the United States anywhere from $6.2 to $41.5 billion, depending on how much of the grid actually fails6,7 — a wide range that is itself the honest finding. Since 1989, operators monitor SWPC warnings, reduce loading, and stage spares when a big CME is inbound; the 2024 G5 passed without a Québec repeat, which is evidence the procedures help, not proof the tail risk is gone.
Satellites: the atmosphere reaches up
Storm energy heats the upper atmosphere, and heated air expands upward — so at a fixed orbital altitude, satellites suddenly fly through measurably thicker gas. On February 3, 2022, SpaceX launched 49 Starlink satellites into a 210 km staging orbit just as two minor storms arrived. Neutral density rose roughly 50% above quiet levels; the added drag overwhelmed the satellites' ability to climb, and 38 of the 49 re-entered and burned up8.
The instructive part: that was a G1–G2 event, the kind that happens dozens of times per solar cycle. The lesson wasn't storm size — it was that low orbits are exquisitely sensitive to atmospheric density, and density answers to the sun. During the May 2024 superstorm, with thousands more satellites aloft, operators faced the same physics at far larger scale: elevated drag, degraded orbit predictions, and constellations maneuvering en masse — a traffic-management problem that did not exist a decade ago.
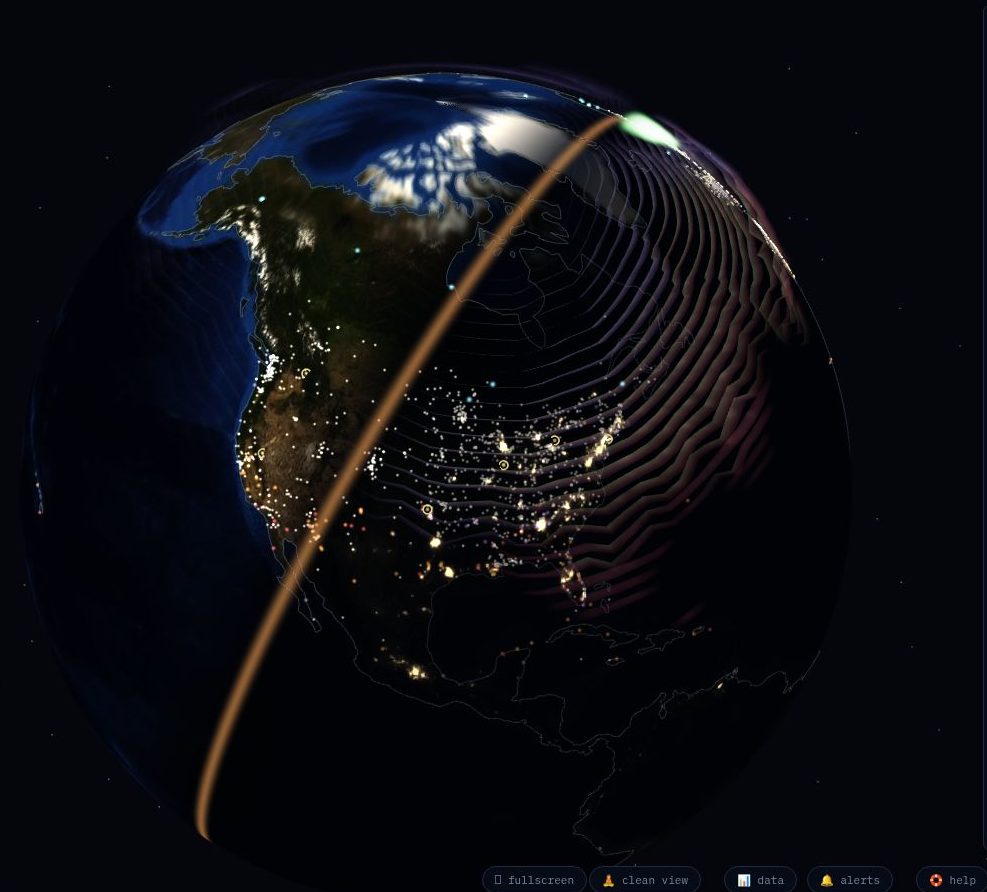
Two quieter failure modes ride along with drag: storm-time particle fluxes charge spacecraft surfaces and electronics (arcing and phantom commands), and single energetic particles flip bits in memory. Most anomalies are recovered; a few each cycle are not6.
GPS: navigation through a wobbling ionosphere
Every GPS fix travels through the ionosphere, and receivers correct for it assuming it changes smoothly. Storms break that assumption two ways: steep, fast-moving gradients in electron density defeat the correction models, and small-scale turbulence — scintillation — makes the signal flicker like a star, until receivers lose lock entirely9.
Ordinary phone navigation degrades by meters and mostly shrugs. The precision systems are the casualties: centimeter-level RTK and differential GPS — the guidance under surveying, drone operations, and modern agriculture. During the May 2024 storm, which arrived in the middle of the US planting season, farmers across the corn belt watched their auto-steer guidance fail for hours at exactly the wrong time of year — the storm's most widely felt technological impact in North America10.
Radio and aviation
The radio effects arrive in two waves. A big flare's X-rays ionize the dayside lower ionosphere within minutes, absorbing shortwave (HF) radio on the sunlit hemisphere — the blackouts NOAA grades on its R scale11. Days later, an arriving CME's energetic protons funnel into the polar caps and shut down HF across the poles specifically — the routes long-haul aviation uses between North America and Asia. During significant events, airlines reroute polar flights equatorward: HF is the required backup where satellite communication coverage thins, and the detour costs real fuel and time6,11.
People: space is the exposed place
On the ground, a storm cannot hurt you — the aurora is a vacuum-thin glow 100+ km up, and the magnetic wobble at your feet is far too small to feel (the risk is infrastructure-mediated, as above). Space is different. In August 1972, an ultra-fast CME — still the transit record holder at 14.6 hours — arrived between Apollo 16 and Apollo 17. The associated proton event was intense enough that an astronaut outside the spacecraft, or even inside the thin-walled lunar module, would have faced a serious radiation dose. The same storm's magnetic signature detonated dozens of US Navy sea mines off the Vietnamese coast — the event that pushed the military to take space weather seriously12.
Today the ISS crew shelters in the station's better-shielded modules during major proton events, and high-latitude airline crews are tracked as radiation workers in several countries — managed exposure, not emergency6.
The shields we actually have
Everything above is why space weather is forecast at all. The L1 monitors 1.5 million km upstream read the actual wind — including the decisive Bz — 15 to 45 minutes before it arrives; SWPC turns that into the G/S/R-scale warnings that grid operators, satellite controllers and airlines act on. The forecast's hard limits are physics, not funding — what forecasts can and can't do covers them honestly. For your own early warning, the tonight page reads the same feeds, and the observatory's free push alerts fire on flares, storm levels, solar wind and proton events — the consumer edition of the alarms the professionals watch.
Frequently asked questions
- Could a solar storm really take down the grid for months?
- That's the tail-risk scenario studied since the 2008 National Academies report flagged hard-to-replace high-voltage transformers as the chokepoint6. It has never happened — Québec 1989 was hours, not months — and grids have hardened procedures since. But a Carrington-class storm against a modern interdependent grid is genuinely outside experience, and honest answers stop there: the studied range is wide because the uncertainty is real.
- Do geomagnetic storms affect people on the ground directly?
- No. The aurora happens 100+ km overhead and the surface magnetic changes are orders of magnitude too weak to affect a body. Every real risk is routed through technology — power, navigation, communication. (More in the great storms FAQ.)
- Was the 2022 Starlink loss caused by a giant storm?
- No — and that's the point. It was a pair of minor G1–G2 storms; a ~50% rise in upper-atmosphere density was enough to doom 38 satellites parked in a very low staging orbit8. Sensitivity, not storm size, was the story.
Sources
Numbered references for the claims above, DOI-verified where a DOI exists.
- Boteler, D. H. (2019). A 21st century view of the March 1989 magnetic storm. Space Weather 17, 1427–1441. doi:10.1029/2019SW002278
- Pulkkinen, A., Lindahl, S., Viljanen, A. & Pirjola, R. (2005). Geomagnetic storm of 29–31 October 2003: geomagnetically induced currents and their relation to problems in the Swedish high-voltage power transmission system. Space Weather 3, S08C03. doi:10.1029/2004SW000123
- Love, J. J., Hayakawa, H. & Cliver, E. W. (2019). Intensity and impact of the New York Railroad superstorm of May 1921. Space Weather 17, 1281–1292. doi:10.1029/2019SW002250
- Hapgood, M. (2019). The great storm of May 1921: an exemplar of a dangerous space weather event. Space Weather 17, 950–975. doi:10.1029/2019SW002195
- Tsurutani, B. T., Gonzalez, W. D., Lakhina, G. S. & Alex, S. (2003). The extreme magnetic storm of 1–2 September 1859. J. Geophys. Res. 108, 1268. doi:10.1029/2002JA009504
- National Research Council (2008). Severe Space Weather Events — Understanding Societal and Economic Impacts. National Academies Press. doi:10.17226/12507
- Oughton, E. J. et al. (2017). Quantifying the daily economic impact of extreme space weather due to failure in electricity transmission infrastructure. Space Weather 15, 65–83. doi:10.1002/2016SW001491
- Dang, T. et al. (2022). Unveiling the space weather during the Starlink satellites destruction event on 4 February 2022. Space Weather 20, e2022SW003152. doi:10.1029/2022SW003152
- Kintner, P. M., Ledvina, B. M. & de Paula, E. R. (2007). GPS and ionospheric scintillations. Space Weather 5, S09003. doi:10.1029/2006SW000260
- NASA (2025). How NASA tracked the most intense solar storm in decades — May 2024 (Gannon) storm impacts, including GPS-guided agriculture disruptions. science.nasa.gov
- NOAA Space Weather Prediction Center. NOAA Space Weather Scales (G, S, R). swpc.noaa.gov/noaa-scales-explanation
- Knipp, D. J. et al. (2018). On the little-known consequences of the 4 August 1972 ultra-fast coronal mass ejecta. Space Weather 16, 1635–1643. doi:10.1029/2018SW002024
By The Space Weather Observatory · checked against the data & methods record · Updated August 21, 2026
the sky · the sun · field guide · data & methods · about · privacy · pro · ☁️ seasonmap · ☕ support