MEDIA & BROADCAST KIT
When the story is the sky, show your viewers their sky. Broadcast-ready aurora clips and licensed live embeds, rendered by the Observatory's photo-validated physics engine from measured storm data — any city, any moment of the storm, any facing. None of it is generative AI, so it files cleanly under your newsroom's AI-disclosure policy: label it what it is, a physics simulation of measured data.
Sample: broadcast clip
The May 2024 G5 superstorm (the "Gannon storm"), reconstructed from measured data, standing in Minneapolis and facing north-northwest as the substorm expands — cut straight from the engine at 1080p. This sample carries the provenance watermark; licensed deliverables ship clean, with the provenance line supplied as lower-third text instead.
Download: sample clip (mp4, 16:9 1080p) — vertical 9:16 cuts for digital and social are part of every pack.
Sample: stills
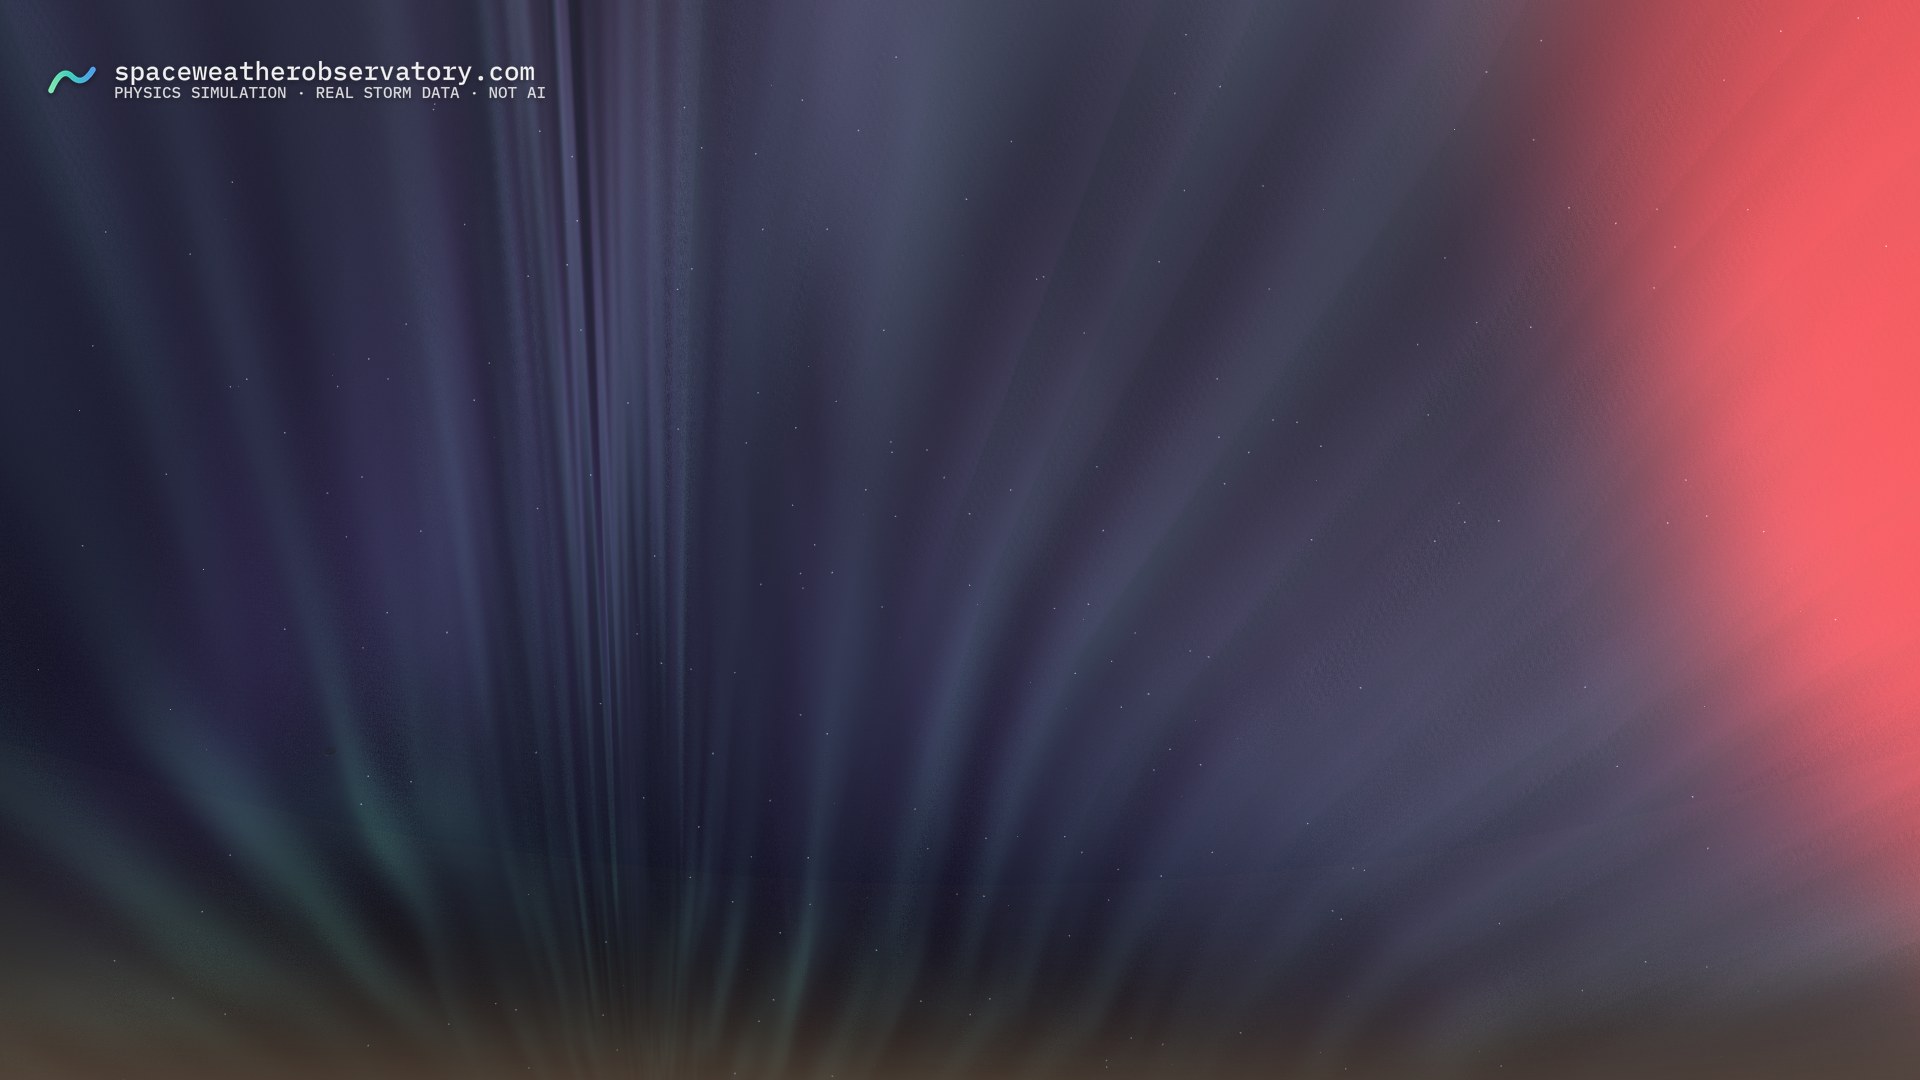
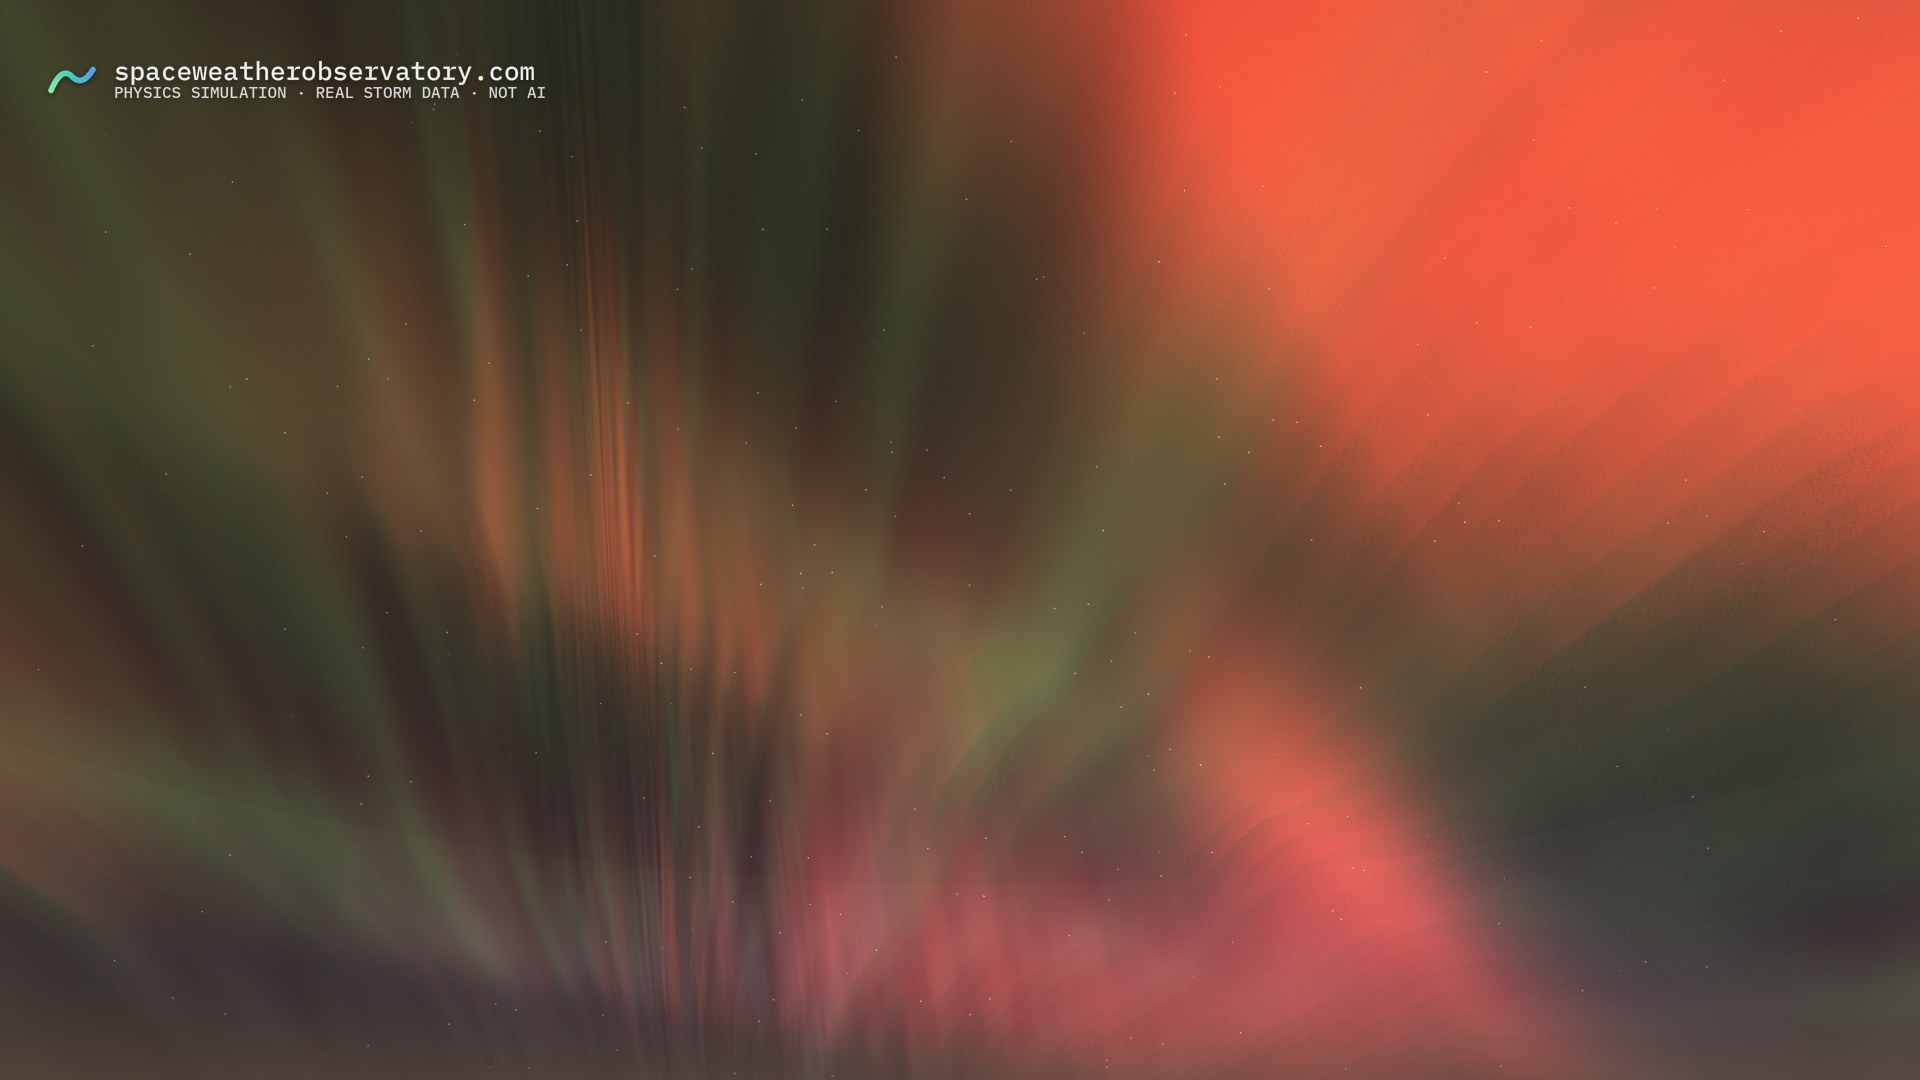
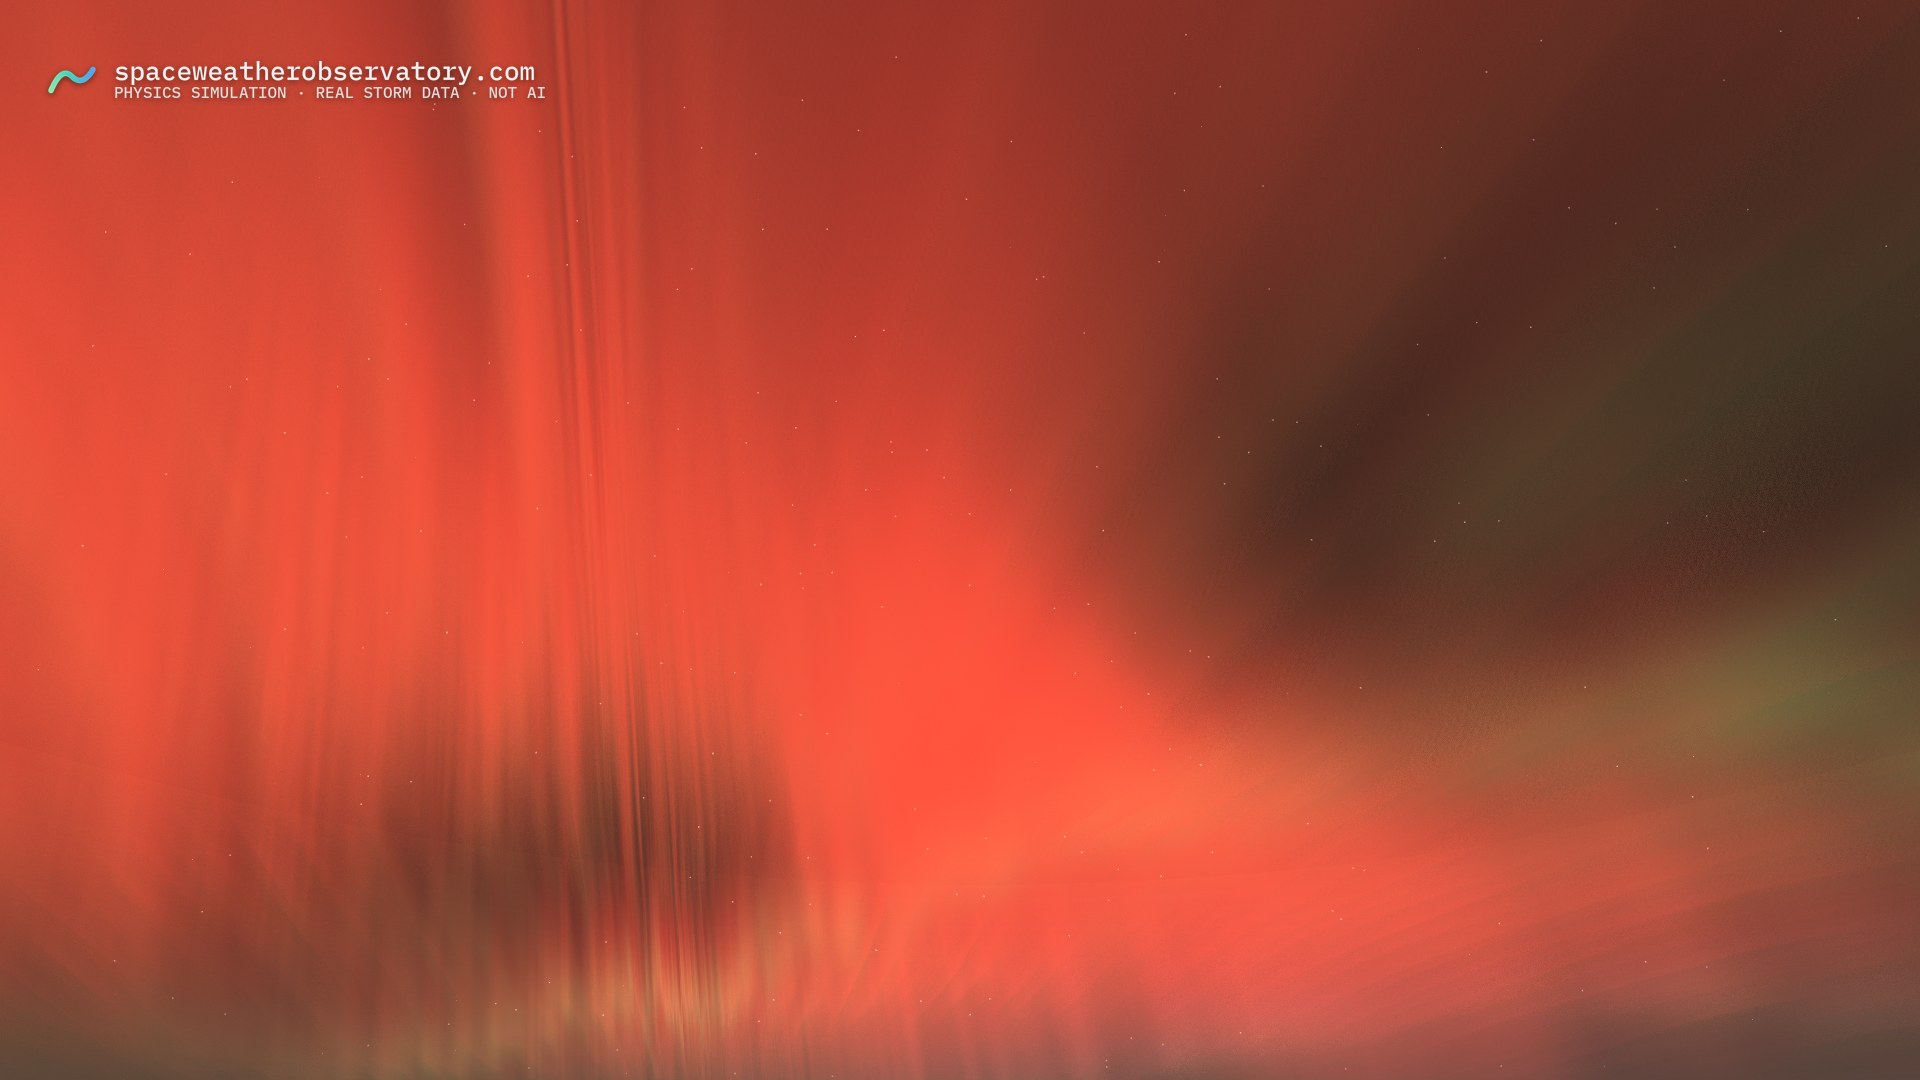
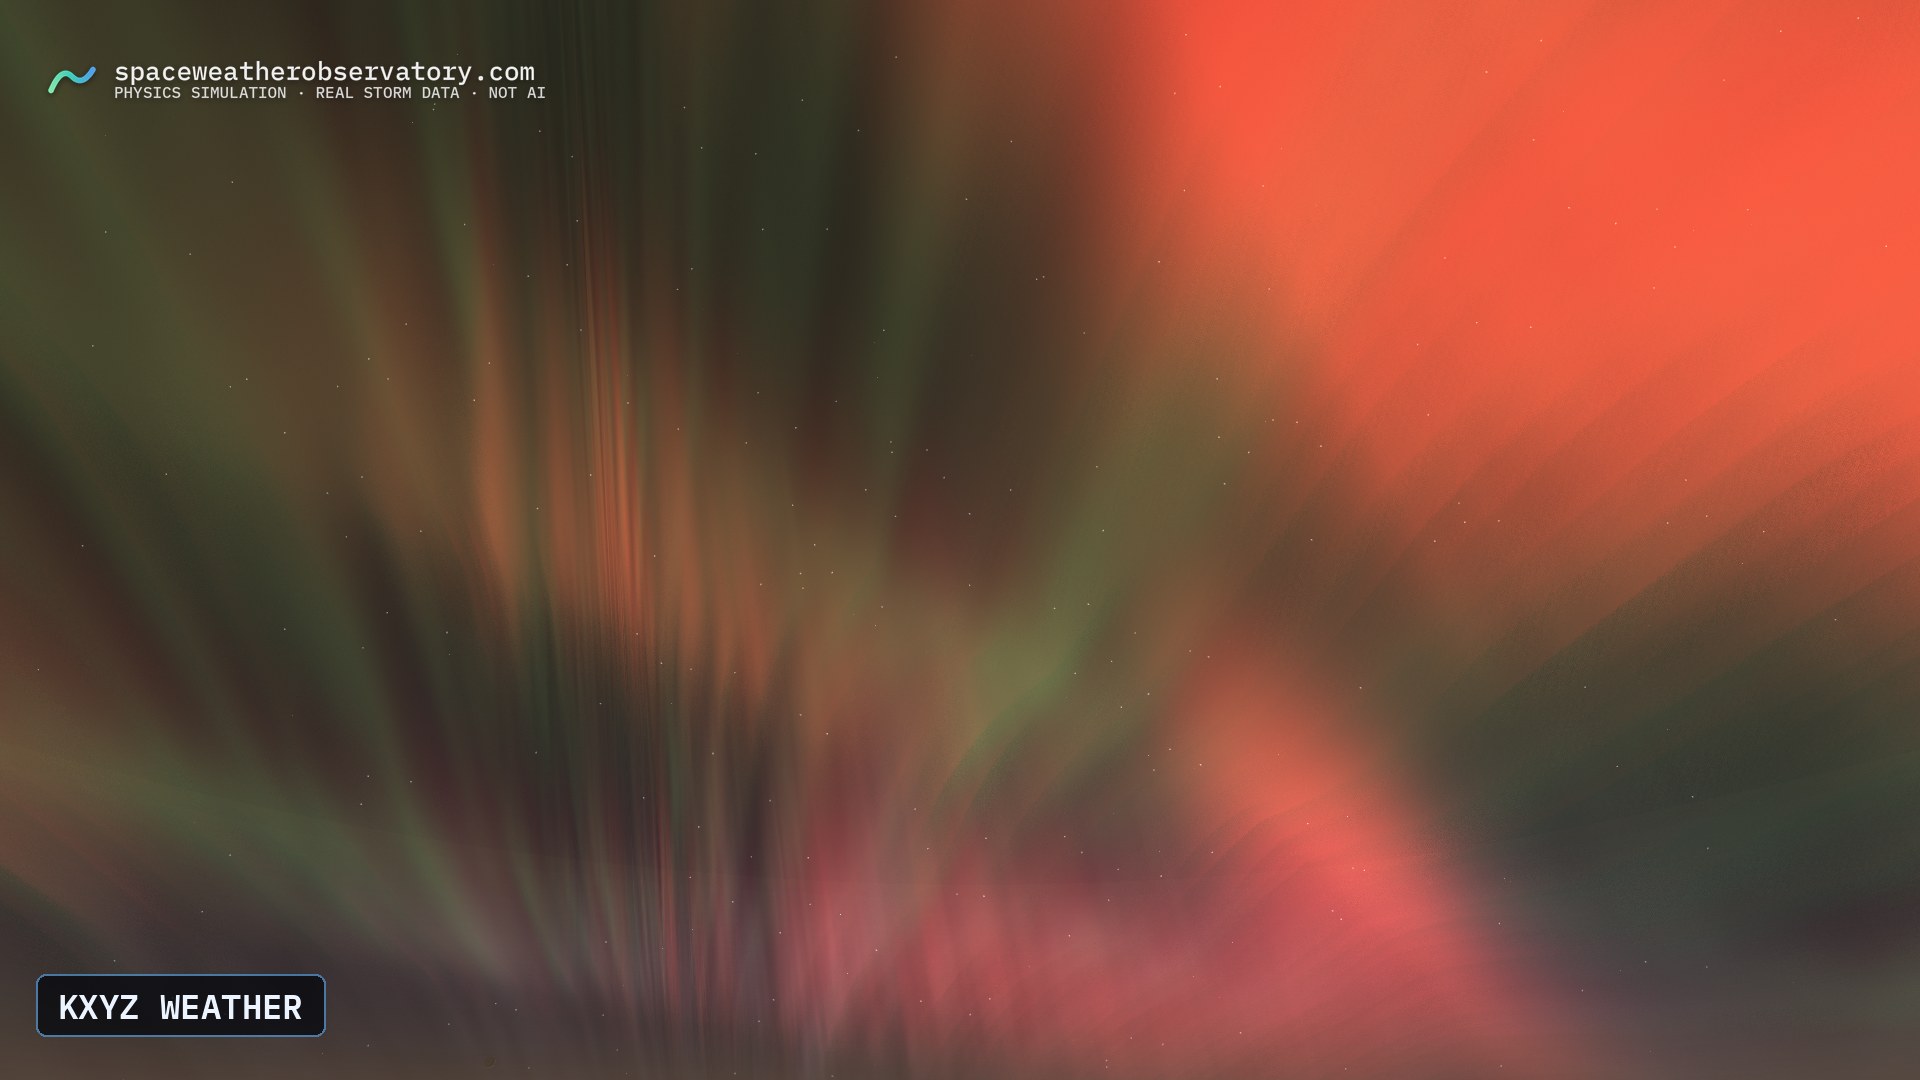
Every pack is rendered fresh for your cities and moments — these samples are the actual product, not mockups.
Sample: the live embed
"What does the aurora look like over [your city] right now?" — a licensed, ad-free iframe, keyed to your domain, community photos off, honesty labels on. Below: the live demo, running on the public demo key (partner keys unlock clean 1080p, your domain, your brand):
On storm day the same widget follows the live sky; between storms it can sit on a replay. One iframe line, keyed to your domain. And when the question is "is it happening right now?", GET /v1/nowcast answers from measured L1 solar wind, arrival-time aware.
Your maps, your graphics team — the data itself
Everything the Observatory computes is importable. The auroral oval — live or forecast — ships as portable GeoJSON, so your graphics department can pull it straight into the Mapbox, Leaflet, Google Maps, or ArcGIS stack they already run and style the band to your show's look:
GET https://swo-api.jacobsprankle.workers.dev/v1/oval.geojson?when=now&key=YOUR_KEY
Both hemispheres, the equatorward visibility line, and honesty + attribution fields carried in the feature properties. when=now rides measured L1 solar wind; night0–night2 are the forecast nights. Integration notes: Observatory Pro.
No graphics build this time? The same layer is a zero-code widget — night basemap, day/night terminator, your market's marker, a now-through-+2-nights switcher — one iframe line: <iframe src="…/embed/map?key=YOUR_KEY&switcher=1">
For data journalism and storm-night automation: GET /v1/nowcast and GET /v1/forecast return clean JSON with the uncertainty stated, and POST /v1/watch fires a webhook when the sky over your market crosses a threshold — an auto-publish trigger, so your alert goes out while the sky is still green. Any observatory link pasted into your CMS auto-embeds via oEmbed.
What's in an event clip pack BETA
| Item | Details |
|---|---|
| 6 broadcast cuts | 16:9 1080p MP4, 6–10 s each — your choice of cities, storm moments, and facings |
| 6 hero stills | 1080p+ exposure-stacked frames, matched to the cuts |
| Vertical versions | 9:16 cuts of any selection, for digital and social |
| Provenance text | lower-third wording supplied per asset ("Physics simulation · real storm data · not AI") |
| Station bug | your logo burned in bottom-left on request |
| Delivery | best-effort same-day; historical replays typically within hours |
Any storm in the library — the live event as it happens, May 2024, October 2024, the 2025 storms, or the great historical reconstructions (Carrington 1859, Halloween 2003) — plus dial-driven hypotheticals from Storm Lab for explainers ("what would a Carrington-class storm look like over us?").
And on storm night, it cuts itself BETA: for newsroom-annual subscribers, the moment the measured solar wind crosses G3 (Kp 7) the engine renders your markets' skies from the live driving — one still, one clip, per city — and stages the pack under your key, webhook ping included. The assets are waiting before the planning call convenes.
Rate card
Every license includes the one-page license, honest-labeling terms, and a direct line to the builder.
| Product | Price | What you get |
|---|---|---|
| Single broadcast clip | $149 | one rendered cut (both aspects), perpetual editorial use |
| Storm event clip pack | $349 / event | everything in the table above, one storm event |
| Live news widget | $199 / mo per property | keyed ad-free live-sky embed, live oval-map widget, oval GeoJSON layer, nowcast/forecast API |
| Newsroom annual | $1,900 / yr per property | the full widget & data license, and every G3+ event pack auto-delivered |
Education is different: classrooms and school planetariums use the observatory free, forever.
How buying works
- Say hello — the button below opens a short form (outlet, what you need, markets, deadline). Media inquiries are triaged first.
- One-page license — plain language, readable in two minutes: attribution, honest labeling, what's included. Accepted by reply email.
- Invoice — Stripe invoice, card or ACH.
- Delivery — your key and first assets ship on payment, best-effort same day.
The fine print, honestly
- Attribution: "The Space Weather Observatory — spaceweatherobservatory.com" on-screen or adjacent, always.
- Labeling is a license term: this is a physics simulation of measured data — the supplied provenance line stays legible. Cropping it out is a breach, because this observatory's credibility is the product.
- Community photos are never included: the visitor photo corpus is licensed for research display by its contributors, not for commercial use — commercial deliverables and embeds run with it off.
- Not for safety-critical use: forecasts ride NOAA public data; this is journalism and wonder, not operational space-weather guidance.
Press-kit basics
Boilerplate — copy, paste, done
The Space Weather Observatory (spaceweatherobservatory.com) is a free, interactive 3D reconstruction of Earth's aurora — the live sky right now, and the great storms from Carrington 1859 to the May 2024 superstorm — computed by a physics engine from measured space-weather data and validated against hundreds of eyewitness photographs. There is no generative AI in its render path: every frame is a labeled physics simulation.
Fact sheet
- Six measured storm reconstructions (2023–2025), including the May 2024 G5 "Gannon" superstorm — plus Carrington 1859, Halloween 2003, and the live sky, always on.
- Rendering validated against hundreds of eyewitness photographs of the May 2024 storm; model-vs-measured honesty labels on everything, sitewide.
- Data: NOAA SWPC — WSA–Enlil solar-wind forecast and measured L1 solar wind (public domain). No NOAA endorsement implied.
- Free for the public; free forever for classrooms. Licensing is what funds it.
- Independent — built and operated by one person. Builder available for background and interviews via the form above.
Brand assets


Download: lockup · provenance banner — white on transparent, for credits, lower-thirds, and end cards. Please don't recolor or restyle them, and the provenance wording stays intact wherever it appears.
For your standards desk
- Is this camera footage? No — it is a physics simulation rendered from measured storm data, and it must be labeled that way. We supply the wording.
- Does it trip our generative-AI disclosure policy? There is no generative AI in the render path. The correct disclosure is "simulation," and the supplied lower-third already says it.
- How accurate is it? Reconstructions are driven by each storm's measured record and validated against eyewitness photographs. Forecast products state their uncertainty in plain language — the forecast knows the wind, not the field direction.
- Can we present it as what the sky really looked like? As a faithful simulation of it, yes — that is exactly the framing the license requires.
Delivery specs
| Asset | Spec |
|---|---|
| Clips | 1920×1080 (16:9) and 1080×1920 (9:16), 30 fps, H.264 MP4 · 6–10 s standard, longer on request |
| Stills | 1920×1080+ exposure-stacked frames, JPG or PNG |
| Custom | any storm in the library, any city, any moment and facing · station-bug burn-in · other formats on request |
| Delivery | direct download links · best-effort same-day |
the sky · observatory pro · storm lab · the storms · data & methods · about · privacy · terms